
Downloading Reports
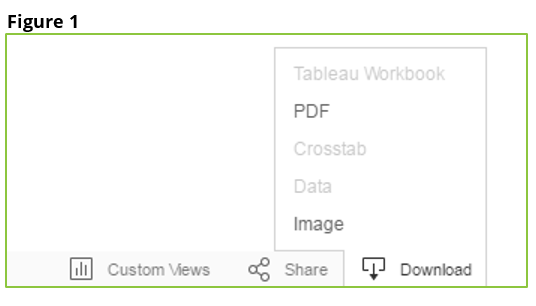
Users can download a PDF of reports. Select the “Download” icon in the lower right-hand corner of the report screen. Select “PDF” from the pop-up menu that will appear (Figure 1). Users can print or save the report PDF after downloading the file.
Accessing Underlying Client Level Data
Click on the category title for the data you want to examine further. A pop-up box will appear (Figure 2).
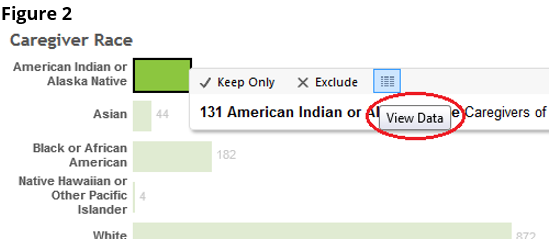
Three options are displayed along the top of the pop-up box: “Keep Only”, “Exclude”, and “View Data”. Click “View Data” (Figure 2) to access underlying data.
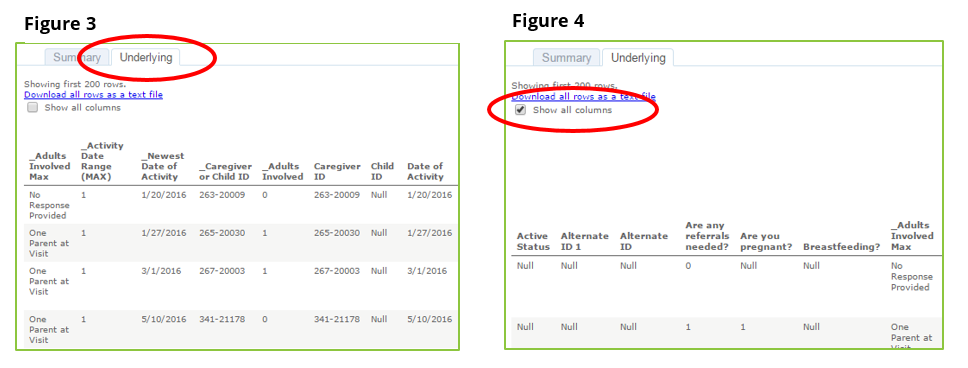
A new window opens with two option tabs at the top: “Summary” and “Underlying”. Select the “Underlying” tab (Figure 3). The data elements involved in creating the chart will be displayed. This should usually give you what you need to complete data clean-up or quality assurance work.
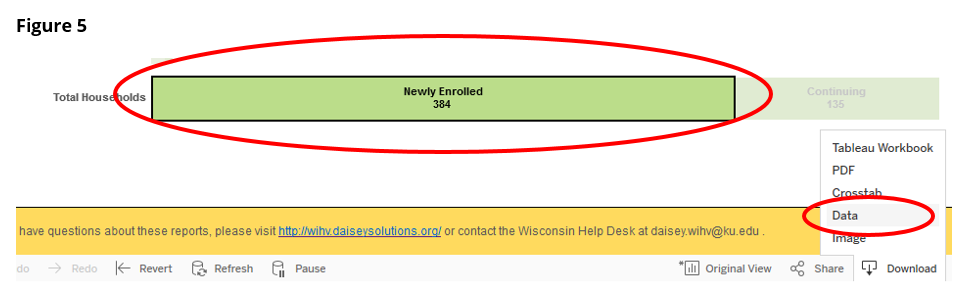
If you need to see the full data set, not just the data elements used to make the chart, click the checkbox next to “Show All Columns” (Figure 4).
Note: Users with the Reviewer role do not have access to underlying data. If the option is grayed out, you do not have access to underlying data.
Accessing Underlying Data from Totals in Reports
Many report visualizations have a “Total” or “Grand Total” at the bottom of the chart. To access the underlying data from totals in DAISEY reports, click on the total bar on the chart (Figure 5), then click the “Download” button and select “Data” from the menu. This will open a new window, identical to the window displayed in Figure 3, from which users can view and download the underlying data for the selected total.
Exporting Data and Correcting Data Errors
To export, select “Download all rows as a text file” from the “Underlying” tab. A CSV file of the entire data set will download. Users can use an application such as Excel to sort and filter this data set and identify the client ID for any client with data errors. The user can then navigate to DAISEY, look up the client, and correct data errors.
Reminder: DAISEY reports are updated daily. If you make any corrections to your data in DAISEY, they will be reflected in the report the following day.